Executive operating briefs
Connect material changes across revenue, delivery, finance and people to business priorities.
Founders & CXOs
Stop asking five people for the same number. See your forecast, your biggest risks, and what needs your attention — updated live, not in a weekly report.
See business goals, operating signals and decisions with the responsibilities behind them.
Connect material changes across revenue, delivery, finance and people to business priorities.
Relate a blocked goal to its dependencies, owners and customer or financial consequences.
Assemble options, assumptions and supporting evidence before committing resources.
Carry an approved decision into responsible teams and review the observed results against the goal.
These feature patterns use connected, permitted information. Supported systems and authorized actions are confirmed for your deployment.
Explore the real Workbench application. Every screenshot below is captured directly from the authentic codebase—preserving the canonical left navigation shell, role-specific Work projections, demonstration telemetry cards, and context-aware Spine Twin controls.
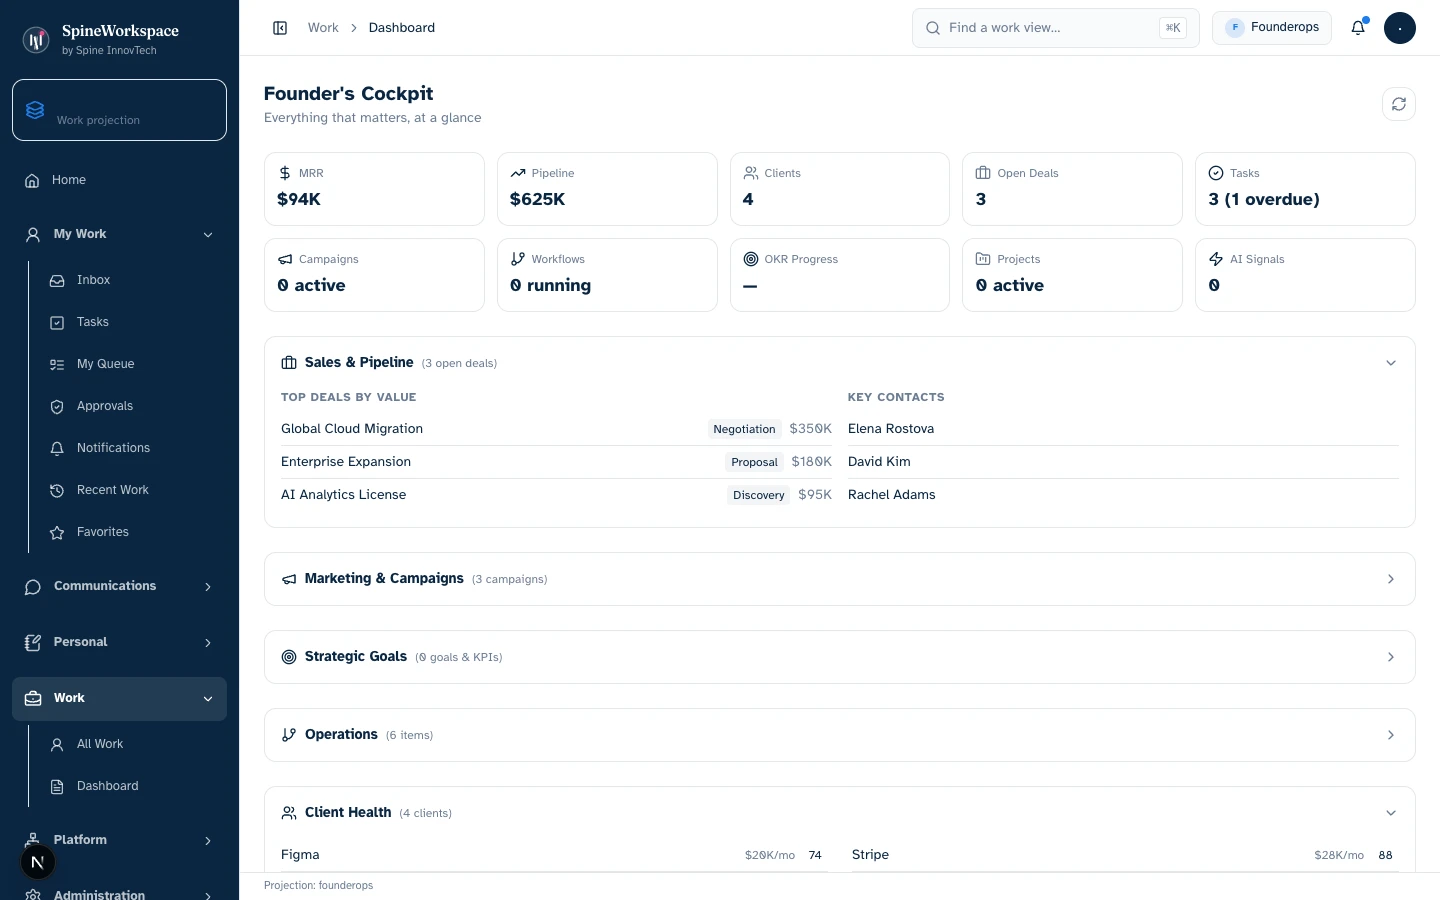
Founder Ops projection.Value Architecture · Founder Ops Workbench
High-level operational cockpit displaying demonstration fixture metrics: MRR ($94K), aggregate pipeline value ($625K), active client count (4), open deals (3), overdue tasks, top deals by value with named client contacts, and cross-company OKR progress.
Drill down into individual high-value deals, review company-wide operational items, monitor client health indicators, and direct executive attention to overdue commitments.
Eliminates piecing together revenue spreadsheets, pulling CRM deal reports, and scheduling status syncs just to know current business pulse.
Provides leadership with immediate, cohesive operating context across business systems without manual spreadsheet assembly.
Every visual asset is captured from the genuine local Spine Workspace Workbench application running real React components with deterministic demo state. Metrics and figures reflect demonstration fixtures, not audited production data. Projections adapt based on connected sources, credentials, and organizational permissions.
Explore the adaptive architecture01 / Situation
A growth target conflicts with current delivery capacity and budget.
02 / Twin prepares
Twin prepares the revenue assumptions, capacity constraints, resource options and earlier decisions.
03 / Authorized next step
The leadership team chooses the tradeoff and authorizes the resulting commitments.
Considering SpineWorkspace for Founders & CXOs? Evaluate this workflow with your team and confirm the supported tools, included capabilities and subscription terms.
Explore subscriptions & pricingIllustrative workflow examples, not measured customer results.
Monday morning
Open Slack, email, CRM, billing dashboard. Ask 3 people for the latest numbers. Get 3 different answers.
Open SpineWorkspace. One screen: top 10 at-risk accounts, forecast drift, cash runway, pipeline health — all live.
Board prep
Three days of slide-building. CFO sends one version, CRO sends another. Numbers don't match. Scramble to reconcile.
One click. Board deck generated from live data — NRR, burn rate, pipeline coverage, top risks — with evidence links.
Escalation
VP of CS tells you a big account is at risk. You ask 4 follow-up questions. Nobody has the full picture.
You see the account's full story: usage trends, support history, payment status, recent communications. Act in minutes, not days.
Strategic decisions
Gut feel plus a spreadsheet. 'I think we're losing enterprise customers but I'm not sure why.'
Evidence-backed signals: 'Enterprise churn correlates with onboarding stalls in month 2. Here are the 8 accounts at risk.'
Define success against your own baseline. These are evaluation areas, not measured customer results.
Your top accounts ranked by risk and revenue. Click any one and see the full picture — usage, support, payments, communications.
Pipeline coverage, deal slippage, and renewal risk — compared to last week. You see what moved and why.
Burn rate, collections forecast, and revenue trajectory — connected to actual customer health, not just projections.
A single-screen summary of what changed this week. Auto-generated every Monday with evidence links.
Critical signals from across the org — flagged for executive review with full context and recommended actions.
Cross-functional signal activity: how many risks surfaced, how many actions approved, how fast things are moving.
NRR, burn rate, cash runway, and pipeline coverage — pulled from your actual systems. One click, not three days of prep.
Every signal shows you the exact data behind it. When you act, you know why. When you share it with the board, they can verify.
See every AI-suggested action — what was proposed, who approved it, what happened. Governance you can actually verify.
You see what changed and why. No critical action happens without executive visibility. Full audit trail.
Connects with
KPIs tracked
SpineWorkspace / Role-specific context
See goals, decisions, and execution in one picture. This solution describes a work pattern, not a promise that a dedicated subdomain or connector is active. Product access and supported environments are confirmed through SpineWorkspace.
SPINE INNOVTECH / WHAT'S NEXT
Explore how our technology connects business context, human judgment and governed AI capability. Start with the company behind the thinking or meet SpineWorkspace, our flagship product.